Did the Progressive Conservatives really win union members’ votes? An examination of union membership voting behaviour during the 2022 Ontario General Election
Marc Zwelling, President
The Vector Poll™
Adrian Macaulay, President
Delphi Polling & Consulting Inc.
After Ontario’s Progressive Conservatives won the provincial election in June, a narrative began to emerge among campaign consultants and pundits that a significant factor to the PC victory was an increase in the number of votes from private sector union members.
On CBC Radio, for instance, the host of “The House,” Chris Hall, said “union votes” were key to “keeping the province blue.” An NDP advisor agreed with the narrative: endorsements from the building trades unions “were vital in creating the image of a new Doug Ford, friend of the working man,” Tom Parkin wrote in The Globe and Mail.
The PCs’ grasp of the union vote is an intriguing story. However, a case can be made that the PCs did not perform as well among private sector union members as some pundits and consultants believe.
The Vector Poll™, an opinion research consultancy in Toronto with a long track record of polling for unions in Canada, found in a post-election province-wide survey that 37% of union members supported the NDP, 29% the Liberals and 19% the PCs (other union members voted for the Green Party, the Ontario Party and the New Blue Party).
While union members throughout the province didn’t turn to the PCs, could even small shifts in their support help the PCs win a few ridings? Only by polling union members in ridings the PCs won would anyone know for sure how many voted for Doug Ford’s Conservatives.
However, there is another way to examine the claim that “elements of organized labour have now divorced themselves from the left…, embracing Ford’s PCs… to fundamentally reshape the political landscape,” as Conservative strategist Jaime Watt wrote in The Toronto Star.
To test the claims that private sector union members had embraced the PCs, Vector Research + Development purchased union membership data from Statistics Canada which included union membership statistics from 2006-2021
Statistics Canada counts employees covered by union contracts, separates them by their job sector — private or public — and sorts them into regional labour markets called census metropolitan areas (CMAs) which Statistics Canada defines as “a large population centre (known as core) together with adjacent fringe and rural areas that have a high degree of social and economic integration with the cores. A CMA has a population of at least 100,000”.
Delphi Polling & Consulting analyzed the June 2 election results for each of the 124 ridings, as well as 2021 union membership data provided by Statistics Canada, and put each riding into a corresponding CMA.
We then categorized the CMAs and their corresponding ridings into five regions: Eastern Ontario, Northern Ontario, Southwestern Ontario, Toronto, and the GTA.
For this study, we examined the unionization rate which Statistics Canada defines as “employees who are members of a union as a proportion of all employees”.
This study took into account a CMA’s overall unionization rate, as well as the unionization rate of both public and private-sector union members and cross references these rates of unionization with the performance of the three major parties during the 2022 election.
The data tables at the bottom of this article provide more information on:
Which CMAs correspond with which region
Which ridings correspond with which CMAs
Performance of the three major parties in the 2022 provincial election
Unionization rates for the CMA: overall, public sector, private sector
Our analysis of the relationship between union membership (both public and private) and voting behaviour found some limitations to the claim that the private sector union members helped propel the Tories to re-election:
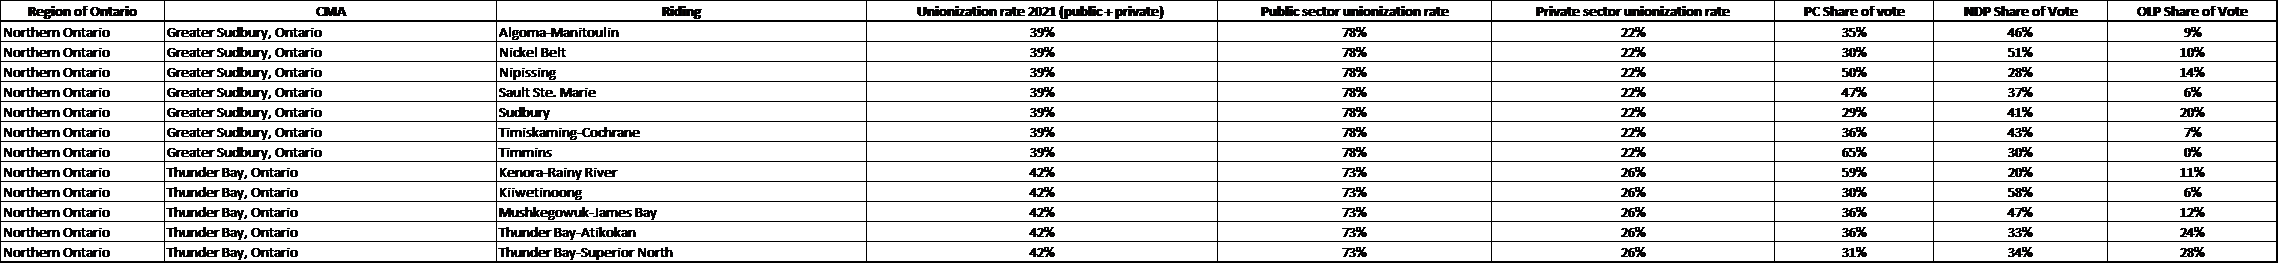
In Algoma Manitoulin, a riding in a CMA where 22% of private sector workers are in unions, the PC candidate won 35% of the vote. The NDP candidate won with 46% of the vote.
In the CMA that includes Thunder Bay-Superior North, 26% of private sector workers are in unions. The PCs won 31% of the vote. The NDP candidate won with 34% of the vote.
In Windsor West, a riding in a CMA where 20% of private sector workers are in unions, the PCs won 35% of the vote. The NDP candidate won with 42% of the vote.
There are similar patterns in other ridings where the Tories’ share of the vote was higher than the private sector unionization rate in the CMA, but the PC candidate lost to the NDP:
St. Catharines
Niagara Falls
Niagara Centre
Oshawa
Nickel Belt
Sudbury
Kitchener Centre
Waterloo
London North Centre
London West
London-Fanshawe
Party leaders exalt union endorsements when they get some and belittle endorsements’ value when they don’t. When union endorsements come with campaign volunteers and financial contributions from individual union members, an endorsement might make a difference.
Labour minister Monte McNaughton, who kept his Lambton–Kent–Middlesex seat, said the week before the election that endorsements from building trades unions show the Tory message was resonating with working Ontarians. “The Liberals and NDP have abandoned working-class people in this province,” he asserted. “The endorsements from private-sector unions demonstrate that.”
The PCs won the election, but the analysis above (and the data tables below) shows that private sector employees didn’t give the PCs an edge.
A more significant story than building trades union endorsements for the PCs is the collapse in voter turnout. Just 43.5% of eligible voters filled in a ballot. The NDP lost more than 830,000 votes from the party’s support in the previous election, in 2018. The Progressive Conservatives lost more than 430,000 votes.
The true story about union votes is that employees in unions are more likely to vote than non-union employees. According to recent polling Vector Research conducted for the Union Opinion Project, 52% of union members in Ontario say they voted - evidence of a union effect on turnout that’s good for democracy.
Data Tables
Eastern Ontario:

Northern Ontario:
Southwestern Ontario:

Toronto:

GTA:
